

Climate maps serve as invaluable tools for visualizing various ecological phenomena, offering insights that go far beyond mere temperature readings. They encapsulate complex relationships among factors such as precipitation, vegetation patterns, weather systems, and climate change indicators, thereby illuminating the diverse tapestry of Earth’s environmental conditions.
At first glance, one might assume that climate maps solely depict temperature variations across different regions. While temperature is indeed a crucial element, these maps can reveal a plethora of other critical climatic attributes. For instance, consider the distribution of precipitation patterns. Rainfall is essential for sustaining ecosystems, agriculture, and human settlements. Climate maps often delineate areas of aridity juxtaposed with regions of high precipitation, highlighting the stark contrasts in humidity levels that dictate the types of flora and fauna that can thrive in any given locality.
Moreover, climate maps frequently illustrate seasonal variations in climatic conditions, capturing the nuances of climatic zones that change throughout the year. Such variations reveal the underlying mechanisms of weather patterns, including monsoons, cold fronts, and prevailing winds. Understanding these dynamics is essential for predicting agricultural outputs, managing water resources, and preparing for extreme weather events.
In addition to temperature and precipitation, climate maps can provide critical information about wind patterns. Wind is a fundamental driver of weather systems and has profound implications for climate. For instance, the trade winds, which dominate the tropics, play a significant role in shaping ocean currents and, consequently, the global climate system. By examining climate maps that illustrate wind patterns, scientists can better comprehend phenomena such as El Niño and La Niña, which significantly influence weather patterns across the globe, including droughts, floods, and other extreme weather events.
Another fascinating aspect of climate maps is their ability to depict vegetation zones. These maps often indicate the distribution of biomes, such as deserts, grasslands, forests, and tundra, which are determined largely by climatic conditions. The intricacies of these relationships exemplify how climatic variables account for the diversity of ecosystems found on Earth. Understanding the interplay between climate and vegetation can ultimately inform conservation efforts and sustainable land management practices.
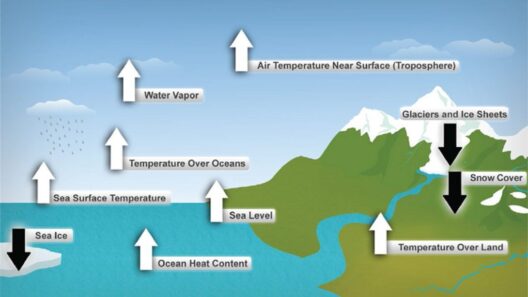
Furthermore, climate maps serve as essential resources in the discourse surrounding climate change. These maps can highlight shifts in climatic patterns over time, illustrating regions that exhibit significant warming or changing rainfall patterns. Such information is critical for understanding how climate change is manifested in different ecosystems and communities. By monitoring these changes, scientists and policymakers can identify vulnerable areas, implement mitigation strategies, and adapt to new environmental realities.
The fascination with climate maps often stems from their capacity to translate complex, abstract data into accessible visual formats. They provide not only a snapshot of current climatic conditions but also a historical perspective. Some maps illustrate how climates have evolved over centuries or even millennia, allowing us to recognize long-term trends and patterns. This historical context enriches our understanding of human influence on the environment, from the Industrial Revolution’s impact to contemporary carbon emissions trajectories.
Moreover, climate maps can illuminate socio-economic implications tied to climate conditions. Regions reliant on agriculture, for instance, are acutely affected by climatic fluctuations. Climate maps can indicate which areas are likely to experience drought or flooding in the future, thus directly impacting food security. This interconnectivity between climate and human activity underscores the pressing need to address climate change holistically, recognizing that environmental health is inextricably linked to economic stability and societal well-being.
In this age of information, technology has made climate maps more dynamic than ever. Interactive climate mapping tools allow users to engage with the data directly, prompting them to explore various scenarios based on different greenhouse gas emission levels. This engagement fosters a deeper understanding of the ramifications of climate change and emphasizes the urgency for collective action. Observing potential future climates through such interactive models can galvanize public awareness and policy initiatives.
Education plays a crucial role in leveraging climate maps for societal benefit. Educational institutions can incorporate climate maps into curricula to promote environmental literacy among students. By instilling an understanding of these maps, future generations can become better equipped to address climate challenges, advocate for sustainable practices, and develop innovative solutions to mitigate adverse effects.
Ultimately, the allure of climate maps lies in their multifaceted nature. They provide a comprehensive view of climatic systems, thereby challenging simplistic interpretations of environmental data. The intricate interplay of temperature, precipitation, wind patterns, and vegetation zones entwined within these maps reflects a greater narrative about our planet’s complexities. As we confront escalating climate crises, recognizing the full spectrum of what climate maps can reveal becomes increasingly paramount.
In conclusion, climate maps offer indispensable insights into not only temperature variations but also the intricate web of climatic factors that shape our world. By unraveling these layers of data, we appreciate the delicate balance of our ecosystems, the implications for human society, and ultimately, the urgency of addressing the challenges posed by climate change. Through engagement, education, and advocacy, we can harness the power of climate maps to foster a more sustainable future.