

Understanding the greenhouse effect is imperative in grasping the complexities of our planet’s climatic system. This phenomenon, often taken for granted, plays a crucial role in sustaining life. Visual aids, such as diagrams, serve as invaluable tools in elucidating the intricate processes at play. A diagram of the greenhouse effect effectively distills these dynamics, making the science behind climate change more accessible to a broader audience. This article delves into the mechanics of the greenhouse effect, its significance, and the urgent implications associated with it.
When gazing skyward, one may notice varying hues of blue, wispy clouds, and the interplay of sunlight streaming down. This natural scene, seemingly simple, is underpinned by complex ecological processes. The diagram of the greenhouse effect encapsulates this interplay, revealing the invisible dance of gases that keep our planet warm enough to harbor life. Through a clear and engaging visual representation, observers can appreciate how solar radiation, absorbed and re-emitted by Earth’s surface, contributes to maintaining a delicate balance in temperatures.
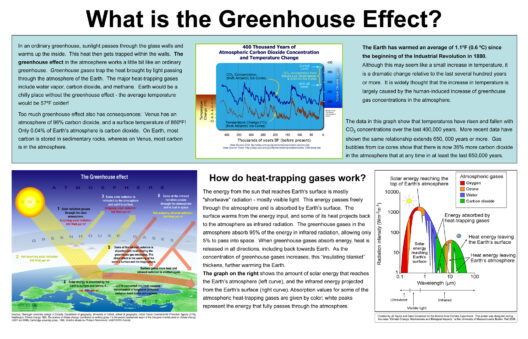
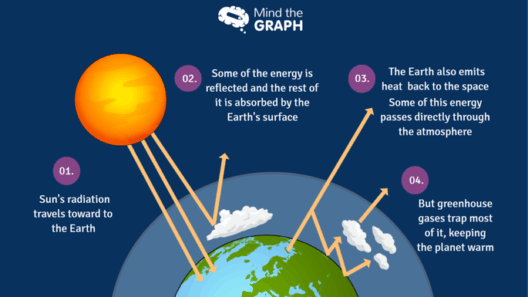
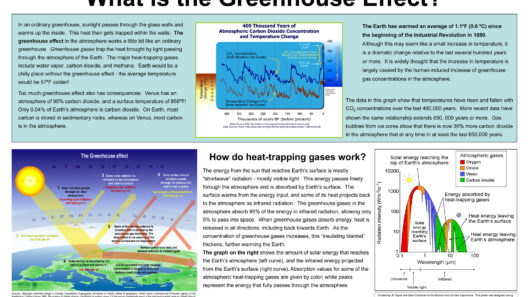
At the heart of the greenhouse effect lies the interplay between incoming solar radiation and outgoing infrared radiation. Not all sunlight reaching Earth is absorbed. Approximately one-third is reflected back into space by clouds, atmospheric particles, and the Earth’s surface. The portion that is absorbed warms the planet, playing a pivotal role in maintaining the global temperature. The diagram illustrates the sun’s rays penetrating the atmosphere, while the Earth emits heat back towards space. However, certain gases in the atmosphere, commonly referred to as greenhouse gases, trap a significant portion of this heat.
Greenhouse gases include carbon dioxide (CO2), methane (CH4), nitrous oxide (N2O), and water vapor, among others. These gases linger in the atmosphere, forming a thermal blanket that inhibits the immediate escape of heat into space. This process is akin to wrapping oneself in a warm blanket on a chilly night. Without these gases, Earth would be inhospitably cold, averaging about -18 degrees Celsius (0 degrees Fahrenheit). Instead, thanks to the greenhouse effect, our planet averages around 15 degrees Celsius (59 degrees Fahrenheit), conducive to life as we know it.
However, the balance is precarious. While natural greenhouse gases are essential, anthropogenic activities have dramatically increased their concentrations since the Industrial Revolution. Fossil fuel combustion, deforestation, and industrial processes exponentially elevate CO2 and methane levels, intensifying the greenhouse effect. The diagram often delineates this escalation, emphasizing the nascent yet profound impact human actions have on Earth’s energy balance.
Recognizing the ways in which this diagram illustrates vital processes is critical. The visual representation not only outlines the pathway of solar energy but invites a broader reflection on the consequences of environmental neglect. Ironically, the same species benefiting from the warmth of this greenhouse effect are also its architects. Such a juxtaposition stirs a sense of urgency to rectify our trajectory towards a sustainable future.
An in-depth understanding of the greenhouse effect also sheds light on other consequential phenomena, such as global warming and climate change. The diagram highlights how temperatures rise as greenhouse gas concentrations increase, leading to shifts in weather patterns, biodiversity loss, and rising sea levels. These changes pose existential threats to countless species, including humanity. It is this interplay of natural processes and human influence that ignites a sense of advocacy for environmental policies aimed at reducing carbon footprints and protecting our ecosystems.
Furthermore, many may find themselves motivated by the moral imperative to ensure a livable planet for future generations. The visualization of the greenhouse effect serves as both an educational tool and a rallying cry for action. It reinforces the idea that by conquering our understanding of the mechanisms at play, we can collectively advocate for informed policies and practices that mitigate the adverse impacts of climate change.
The fascination surrounding the greenhouse effect also stems from the paradox of its necessity and its peril. Humans thrive on the warmth provided by these gases, yet our actions are increasingly destabilizing the climate. Awareness of this duality compels us to seek solutions that harmonize our needs with the health of the planet. Innovations, such as renewable energy sources and carbon capture technologies, offer promise and exemplify the humanity’s capacity to adapt.
As the world grapples with the escalating impacts of climate change, the role of diagrams in communicating scientific concepts is more vital than ever. They not only impart knowledge but evoke emotional responses that can spur individuals and communities into action, fostering collective stewardship of the Earth.
Through an understanding of the greenhouse effect, supported by vivid representations, it becomes evident that every choice made today influences the Earth’s tomorrow. Addressing these challenges requires a concerted effort from individuals, governments, and organizations alike.
In conclusion, a detailed diagram of the greenhouse effect serves as a powerful mnemonic, epitomizing both the scientific beauty inherent in our climatic system and the profound responsibilities that come with it. The visualization encapsulates layers of complexity while distilling it into comprehensible forms, empowering observers to grasp the urgency of the situation. It is through a marriage of knowledge and action that society can forge a more sustainable future, ensuring the longevity of the delicate balance that allows life to flourish on Earth.