


Imagine stepping into the vibrant world of a tropical rainforest. The air is thick with humidity, and the verdant foliage envelops you like a living tapestry. What draws your eye is not only the lush biodiversity but also the intricate climate patterns that shape this unique ecosystem. How do scientists make sense of the interplay between temperature and precipitation? This is where the climate graph for the tropical rainforest comes into play—a pivotal tool for understanding these verdant paradises. However, should we take these graphs at face value, or do they pose challenges that require deeper scrutiny?
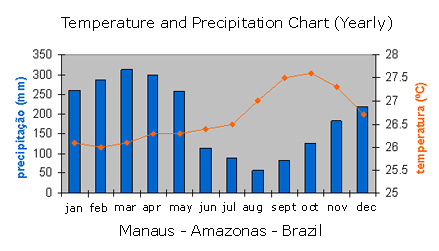
Climate graphs visually encapsulate data about temperature and precipitation over specific periods. In tropical rainforests, these graphs elucidate why these regions boast such rich biological diversity. Typically, the temperature remains relatively constant, hovering between 20°C to 30°C (68°F to 86°F), while precipitation may exceed 2000mm (78 inches) annually. The cyclical patterns embodied in these graphs are not just numbers; they tell stories of life, adaptation, and resilience within this ecologically significant biome.
The x-axis of a typical climate graph represents months of the year, while the y-axis indicates either temperature or precipitation. In tropical rainforests, one might observe a consistent temperature line alongside a precipitous rainfall curve. This duality reveals critical insights. The steady warmth allows for year-round photosynthesis and growth, a factor that categorizes the rainforest as one of the most productive ecosystems globally. The peaks in precipitation, typically occurring during wet seasons, correlate directly with the flourishing plant life, which in turn supports a staggering array of fauna.
However, deciphering this data raises intriguing questions. What happens when temperature fluctuates even slightly, or when prolonged dry spells affect rainfall amounts? The inherent stability of the tropical rainforest is challenged, making this an area ripe for exploration. Climate change has compelled scientists to analyze these graphs more closely. Are the curves beginning to tilt with increasing global temperatures? Does that imply longer droughts or heightened rainfall events? The resilience of the ecosystem is a double-edged sword; while it can adapt, there are thresholds beyond which it may not recover.
For instance, one striking characteristic of tropical rainforest climates is their bimodal precipitation pattern in certain regions, where distinct wet and dry seasons are observable. Yet, the nuances may become obscured in overarching trends. Some data might misrepresent local variability and the adaptation of species therein. Just as individual trees adapt to fluctuating light levels, so too must we comprehend the diverse responses of flora and fauna to changing climatic variables. Understanding this complexity is crucial, for it reveals the delicate balance that sustains the tumultuous life cycles within these ecosystems.
The nuances of climate graphs can also guide us in conservation efforts. For environmentalists, the data helps pinpoint vulnerable sections of various rainforests. Some areas may experience what’s known as “climate refugees,” where certain species can no longer thrive in their native habitat due to shifting temperatures or less predictable rainfall patterns. The interplay between temperature spikes and precipitation shortages, for example, can drastically endanger species at the edges of their ecological comfort zones. Thus, strategy is necessary; conserving specific ecosystems could mean directly addressing the implications illuminated by climate graphs.
All of this data culminates in a larger realization: the tropical rainforest is more than just a collection of trees and wildlife; it is a thriving, living laboratory that requires vigilant stewardship. Researchers and environmental groups face the challenge of predicting future changes, trying to understand how these graphs will evolve within the context of climate change. Additionally, there’s the intricate socioeconomic component. Indigenous communities relying on the rainforest must navigate these shifting patterns, underscoring the dire need for a multidisciplinary approach that interweaves ecological and human narratives.
One potential challenge is engaging the average person with the complexity of climate graphs. For those less versed in scientific terminology, how do we bridge the gap? One approach is through storytelling. Narratives derived from climate data can evoke compassion and urgency, painting a vivid picture of both struggle and resilience. By translating raw data into relatable stories, activists can galvanize support and advocacy, fostering a broader understanding of the stakes involved. This engagement empowers communities to take part in meaningful dialogue about preservation efforts.
A final layer to this discourse involves the potential for technological advancements to revolutionize how we interpret climate data. Artificial intelligence and machine learning algorithms can analyze patterns with remarkable accuracy. By integrating comprehensive climate graphs with expansive datasets, researchers can gain a clearer perspective on the effects of climate change. This technology serves as a double-edges sword; it enhances our predictive capabilities but requires us to address ethical concerns about data manipulation and representation.
In conclusion, the climate graph serves as a critical narrative device, encapsulating the wondrous yet precarious existence of the tropical rainforest. It invites contemplation, challenges our perceptions, and pushes the boundaries of our understanding. As we stand at this crossroads, the responsibility falls upon us to deepen our inquiry, advocate for these irreplaceable ecosystems, and strive for a global community that embraces sustainable living practices. After all, in a world increasingly influenced by climatic shifts, recognizing our shared responsibility is crucial for ensuring that the vibrant tapestry of the tropical rainforest endures for generations to come.