




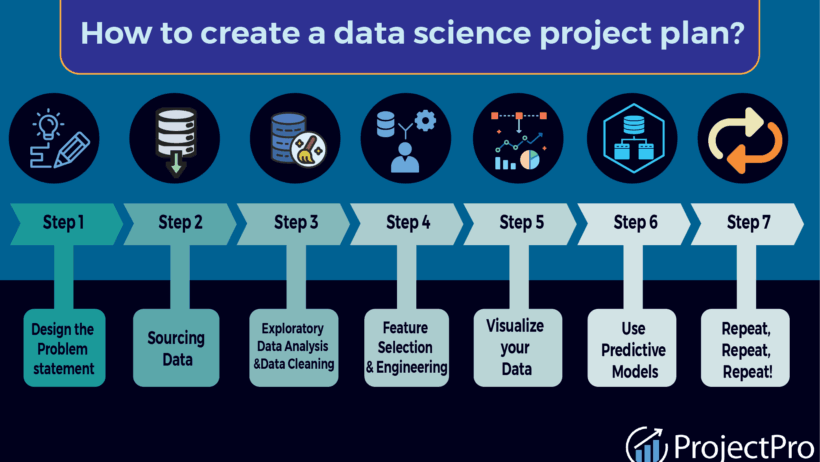

Data analysis is a pivotal component of any scientific project, guiding researchers through the labyrinth of information to extract meaningful insights. This guide chronicles the meticulous journey of data analysis in the context of a science project, outlined in a structured sequence to ensure clarity and comprehension.
1. Define the Research Question
The cornerstone of data analysis resides in a well-articulated research question. This query should be specific, measurable, and aligned with the overarching objectives of the project. For instance, instead of a vague inquiry like “How does temperature affect plant growth?”, consider refining it to “What is the impact of varying temperatures on the growth rate of Brassica rapa?” A clearly defined question sets the stage for focused data collection and analysis.
2. Literature Review
Engaging deeply with existing literature is essential. Peer-reviewed articles, relevant studies, and previous research findings illuminate the topic and provide a contextual backdrop. This examination not only aids in refining your research question further but also helps in identifying gaps in knowledge, which your project may aim to fill. Understanding what methodologies others have utilized allows for a more informed approach to your data analysis.
3. Data Collection Methods
Data collection is the lifeblood of empirical research. Here, diverse methodologies can be adopted based on the nature of the research question. Qualitative data can be gathered through interviews or open-ended surveys, while quantitative data can be amassed through experimental setups or secondary data from databases. Employing a mixed-methods approach can often yield a more nuanced understanding of complex phenomena. Ensure that your sampling method—random, stratified, or convenience sampling—aligns with the objectives and ensures representativeness.
4. Data Preparation
The raw data seldom emerges in a clean, analyzable form. Data cleaning is paramount. This involves identifying and rectifying inaccuracies, handling missing values, and standardizing formats. For instance, if dealing with temperature readings in different units, converting all figures into a uniform metric is crucial. Ultimately, this stage ensures that the dataset is robust and free from anomalies that could skew the analysis.
5. Exploratory Data Analysis (EDA)
Next, embarking on an exploratory data analysis journey facilitates initial understanding. Using statistical tools and visualizations, such as scatter plots or histograms, reveals patterns, trends, and outliers within the data. For example, plotting plant growth against temperature could unveil an unexpected quadratic relationship. EDA is integral in shaping hypotheses and guiding subsequent analysis steps.
6. Hypothesis Formulation
From the insights gleaned during EDA, hypotheses begin to emerge. These statements, posited as potential truths about the relationships within the data, can be tested through various statistical methods. For instance, one might hypothesize, “Increased temperatures will enhance the growth rate of Brassica rapa up to a threshold, beyond which growth diminishes.” Formulating a clear hypothesis drives the subsequent analytical endeavors.
7. Statistical Analysis
Selection of appropriate statistical methods depends predominantly on the research design and type of data. T-tests or ANOVAs may be suitable for comparing means, while regression analysis serves to explore relationships between variables. Familiarity with software tools such as R, Python, or SPSS is beneficial during this phase. Employing these techniques enables rigorous testing of hypotheses, ensuring that conclusions drawn are scientifically valid and not merely anecdotal.
8. Interpretation of Results
Upon conducting statistical analyses, interpreting the results requires astute judgment. Does the data support the initial hypothesis? What do the p-values and confidence intervals indicate about the reliability of the results? This stage necessitates a critical eye, recognizing the limitations of the analysis and considering alternative explanations. The insights derived during this phase enrich the scientific discourse surrounding your research question.
9. Visualization of Findings
Human cognition flourishes in the presence of visual stimuli. Employing visuals, such as graphs, tables, and infographics, transforms complex data into digestible information. These illustrations should succinctly communicate key findings, facilitating understanding among diverse audiences. An effective chart or figure can often encapsulate the essence of the research better than pages of text, bolstering the overall impact of the project.
10. Drawing Conclusions
Conclusions serve as the final judgment on the research question. They synthesize the results and implications of the study, reaffirming or refuting the hypotheses posed earlier. This section should also highlight the contribution of the research to the wider scientific community, encouraging further inquiry into unresolved questions or new avenues of exploration that emerged during the course of the project.
11. Recommendations for Future Research
Scientific inquiry is an iterative process. Based on the findings, recommendations for future research should be articulated. Identify areas ripe for further exploration, possibly envisioning modifications to experimental design or alternative methodologies that could yield more comprehensive insights. These suggestions adorn the research with an element of continuity and growth, paving the way for subsequent investigations.
12. Reflection on the Process
A reflective practice encapsulates the learning journey, contemplating the challenges faced and the methodologies employed. Engaging with this self-assessment enables continuous improvement in future projects, refining analytical skills and enhancing overall research competency. Remember, every data analysis endeavor is an opportunity for growth and enlightenment.
In essence, data analysis forms an intricate tapestry interwoven through meticulous steps, each contributing to the sublimity of scientific exploration. Through a clear structure and a thoughtful examination of various components, researchers can confidently navigate through their projects, unveiling insights that propel knowledge forward.